| row-start col-xs-12 |
Raikoke volcanic aerosol plume
The basis of this additional “Raikoke” webpage was agreed with Jean-Paul Vernier (NASA Langley) in discussion at AGU meeting on Dec 12th 2019, the idea to provide very-brief summary-text (2-3 sentences) alongside key images demonstrating a brief selection of the measurements of the Raikoke volcanic SO2 and aerosol, and fast-response predicted radiative forcing.
Dr. Vernier co-leads the coordination of an international initiative called VolRes, a SSiRC activity to organize the international scientific and atmospheric monitoring communities to prepare a “ Volcano Response plan” to already establish networks among scientists and share knowledge of capabilities, both among modelling and observation scientists.
On 22nd June 2019, the Raikoke volcano in the Kuril Islands in the North Pacific erupted, injecting a substantial amount of sulphur into the stratosphere.
One part of the VolRes activity was to establish a mailing list for scientists to share images of initial observational monitoring and modelling results for eruptions reaching the stratosphere.
After the Raikoke volcanic eruption, initial estimates of the amount of SO2 and ash present, with also the vertical extent of the plume, were shared to the list, with discussion among the participating scientists.
An important outcome from this activity was a document setting out consensus estimates for the “eruption source parameters” for the eruption – to provide best estimate for the potential impacts from the eruption – and to enable modelling groups to apply common input parameters for the amount of SO2 and ash present, and its initial post-eruption vertical distribution.
The page provides only a brief overview of the VolRes activity during Raikoke, highlighting key elements of the observational monitoring as the cloud transformed from initial phase of a highly heterogeneous but relatively localised plume of SO2 and ash, to a transitional phase of SO2 and aerosol, through to a hemispherically-dispersed haze cloud of mainly aqueous sulphuric acid droplets.
The images are staged from the 1st post-eruption day (IASI SO2), producing an estimate of 1.5 Tg of SO2 in the stratosphere, through then to 10 days after the mixed SO2 and aerosol plume progression from combined AIRS SO2 & CALIOP aerosol backscatter analysis.
The page also shows first detection of the Raikoke cloud in the 1st week of July, from the Hautes Provence ground-based lidar, through to a 10-day composite of the hemispherically-dispersed aerosol from satellite-borne lidar in August.
Although the eruption’s impacts on climate were not significant, within the northern hemisphere long-term record from Hautes Provence, the event generated the strongest integrated backscatter signal since the tail-end of the Pinatubo cloud in the mid-1990s.1. First day’s eastward transport of the Raikoke SO2 plume (shared on 25th June 2019)
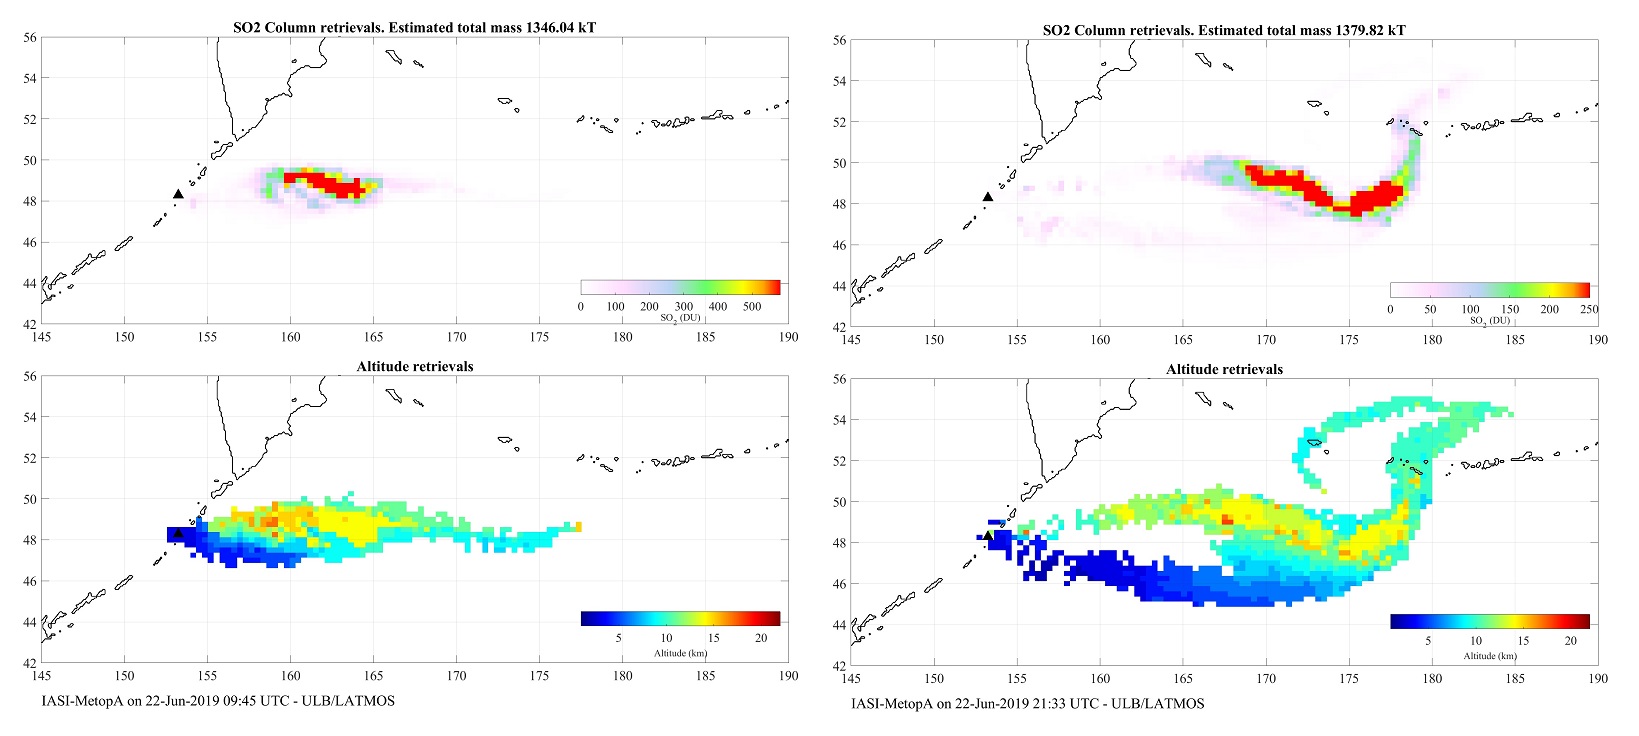
(IASI instrument on MetOp satellite, images from Lieven Clarisse, Univ. Brussels, Belgium)
Two images show the initial stages of the volcanic SO2 plume, as measured from the IASI instrument on the MetOp satellite at 09:00 and 21:00 UT on the 22nd June 2019. Initial SO2 burden estimates varied, the IASI team estimating 1.5 Tg SO2 in the stratosphere.
2. Transitional-phase analysis of the mixed SO2 and aerosol plume (shared on 3rd July 2019)
(AIRS instrument and CALIOP satellite-borne lidar, images from Jean-Paul Vernier, NASA Langley)
Transect of the vertical profile of the volcanic aerosol cloud (measured from CALIOP satellite borne lidar) is analysed for where it co-locates with the AIRS satellite measurements of the SO2.
(AIRS instrument and CALIOP satellite-borne lidar, images from Jean-Paul Vernier, NASA Langley)
Transect of the vertical profile of the volcanic aerosol cloud (measured from CALIOP satellite borne lidar) is analysed for where it co-locates with the AIRS satellite measurements of the SO2.
CALIOP/CALIPSO and AIRS/Aqua observations of the Raikoke volcanic plume
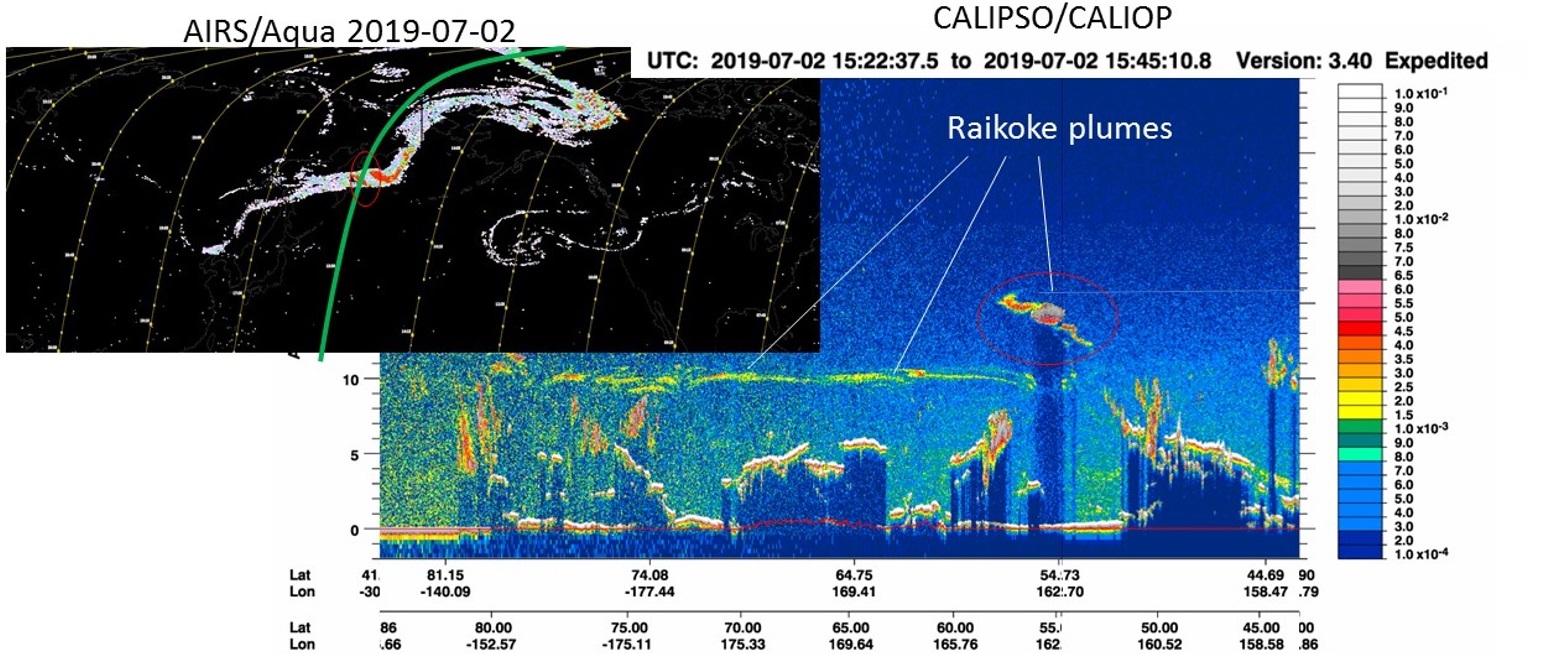
- Quasi-collocated observations of SO2 and aerosols from AIRS and CALIOP
- Large extension of the plume from Russia to N. America
- Plume vertical extension between 9 and 16 km, Diffuse volcanic ash/sulfate in commercial aviation airspace
3. Filaments of the Raikoke aerosol cloud at first detection over Europe (shared on 9th July 2019)
(Ground-based lidar from Hautes Provence observatory, image from Sergey Khaykin, CNRS)
A filament of the Raikoke plume arrived over Europe in the first week of July. This image from 5th July shows two distinct layers, at around 12km and 16-17km. Back trajectories from the 12 km layer are consistent with transport from Raikoke. The 16-17km layer is a smoke plume from fires in Alberta, Canada. Back trajectories are totally inconsistent with Raikoke transport. Moreover, CALIOP depolarization ratio of this high layer is consistent with stratospheric smoke whereas the lower layer has sulfate-like small depolarization ratio. The 12km Raikoke filament was at lower altitude than the main plume, which arrived later, and was detected on all nights at 15-16km.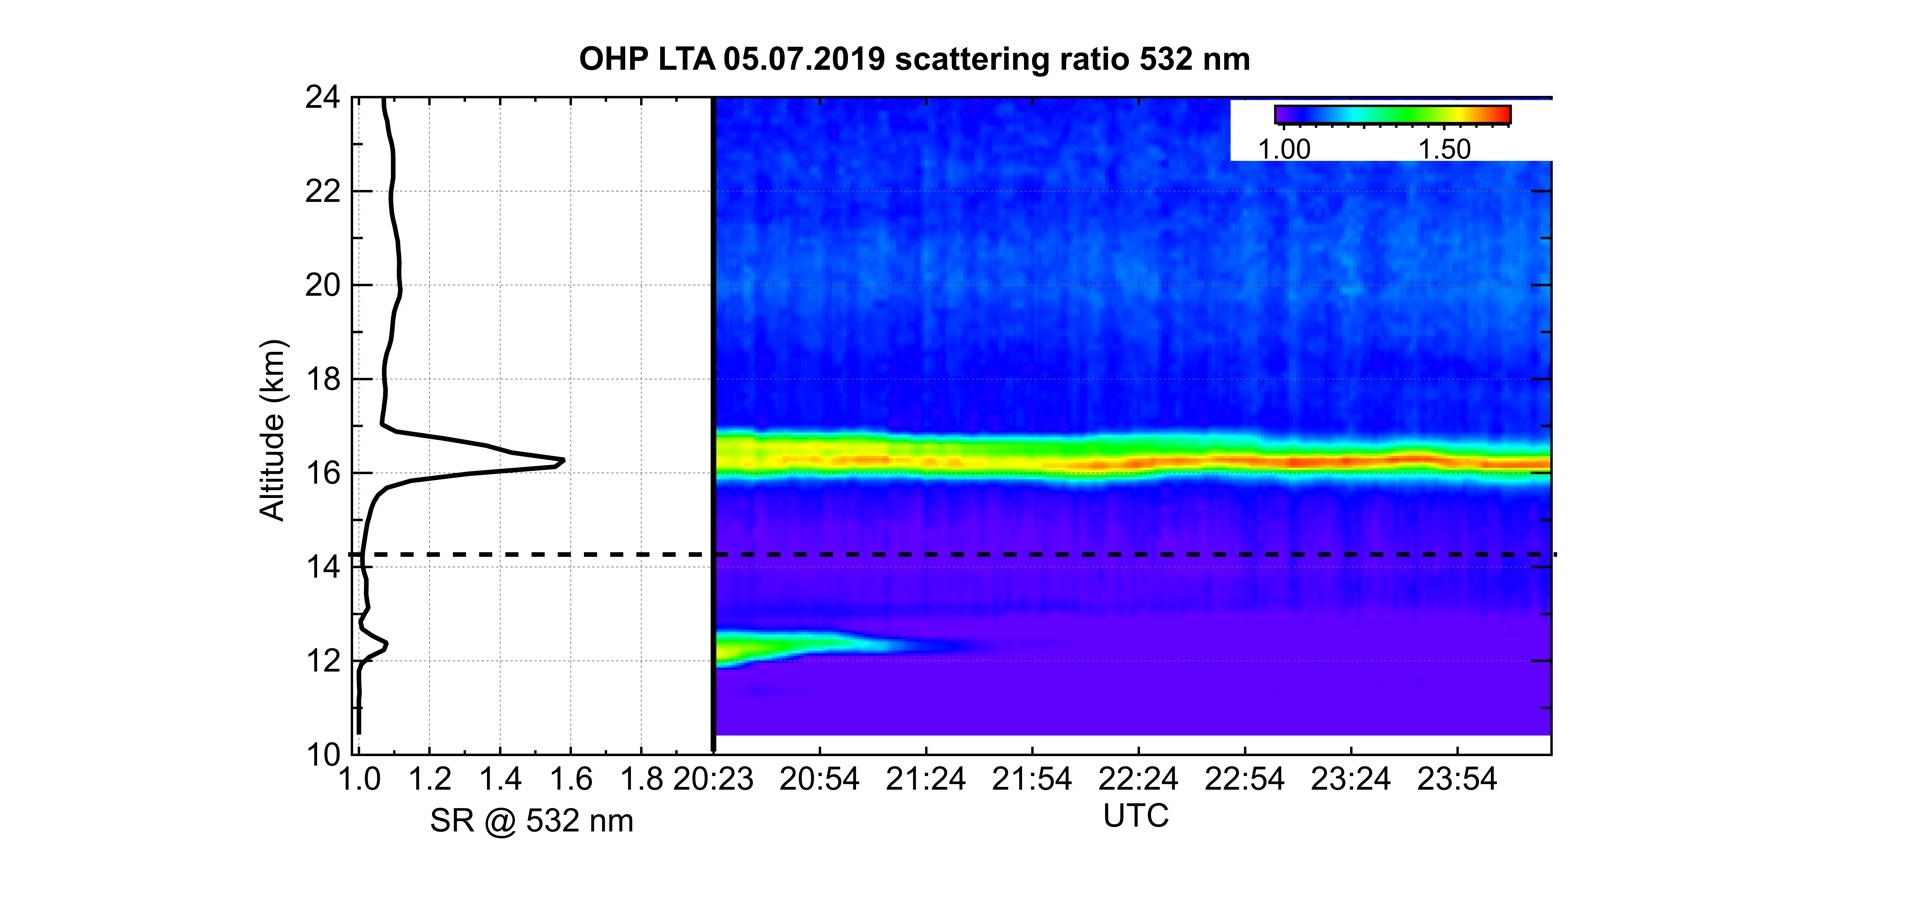
A filament of the Raikoke plume arrived over Europe in the first week of July. This image from 5th July shows two distinct layers, at around 12km and 16-17km. Back trajectories from the 12 km layer are consistent with transport from Raikoke. The 16-17km layer is a smoke plume from fires in Alberta, Canada. Back trajectories are totally inconsistent with Raikoke transport. Moreover, CALIOP depolarization ratio of this high layer is consistent with stratospheric smoke whereas the lower layer has sulfate-like small depolarization ratio. The 12km Raikoke filament was at lower altitude than the main plume, which arrived later, and was detected on all nights at 15-16km.
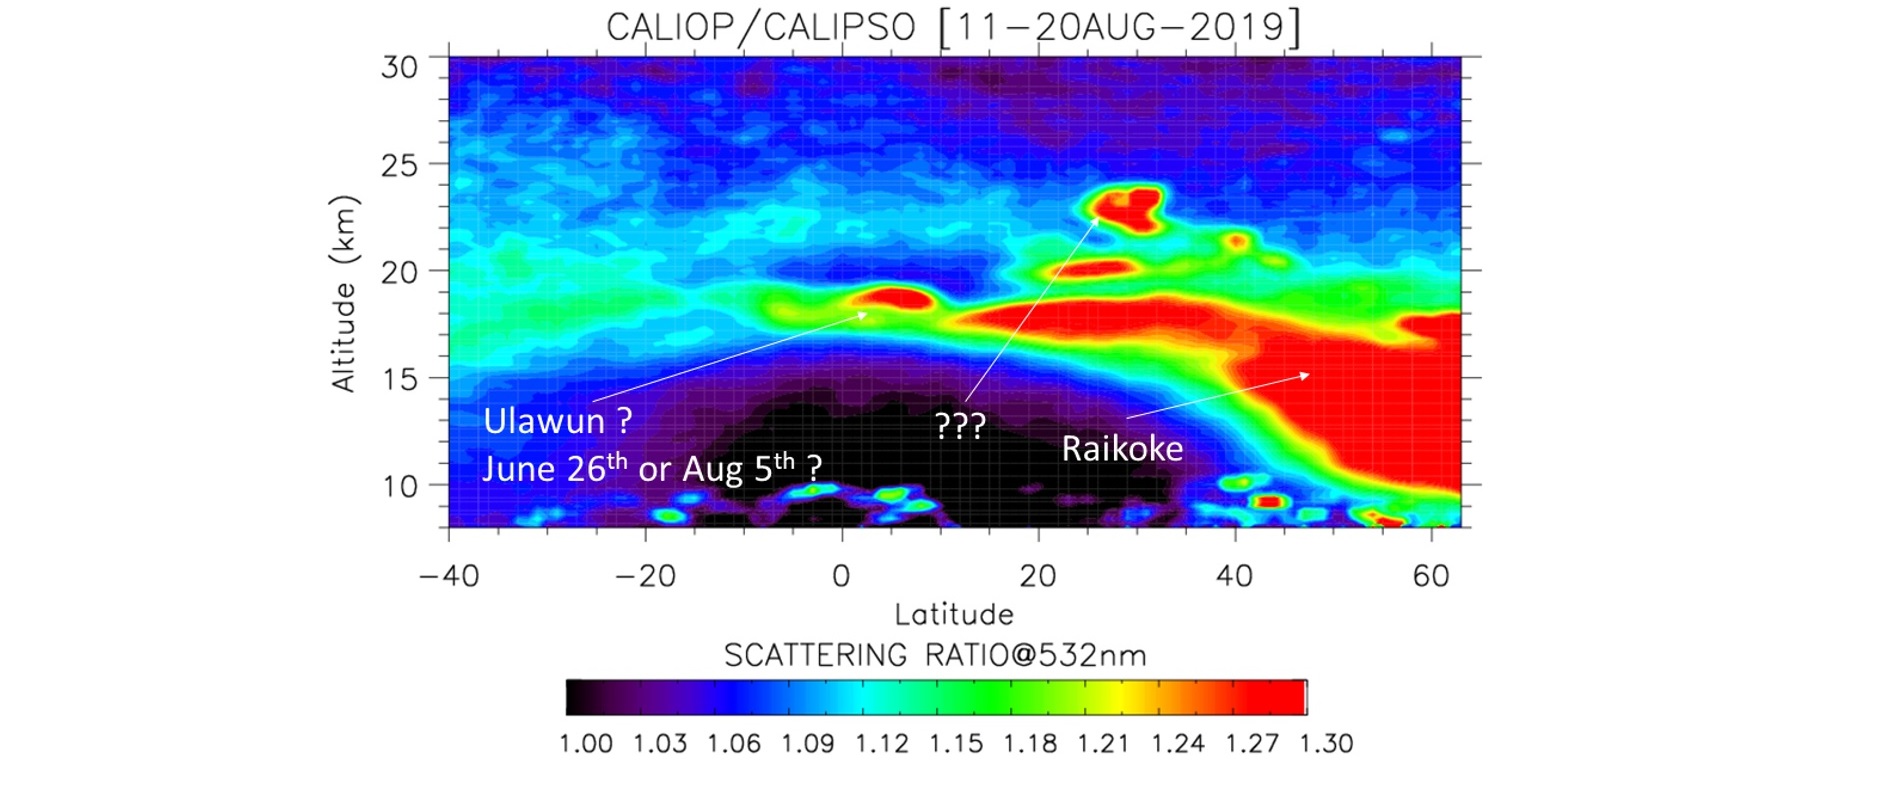
4. Vertical extent of the hemisphere-dispersed Raikoke aerosol cloud (shared on 24th Aug 2019)
(10-day composite from CALIOP, 11th-20th August, image from Jean-Paul Vernier, NASA Langley)
(10-day composite from CALIOP, 11th-20th August, image from Jean-Paul Vernier, NASA Langley)
At this stage, 50-60-days after the eruption, the Raikoke plume has now progressed to a hemisphere-dispersed cloud throughout the mid-latitude Northern Hemisphere lower-most stratosphere, the satellite-borne lidar showing the vertical extent at this developed phase.
Also shown are two long-term time-series images, to provide context for the Raikoke event.
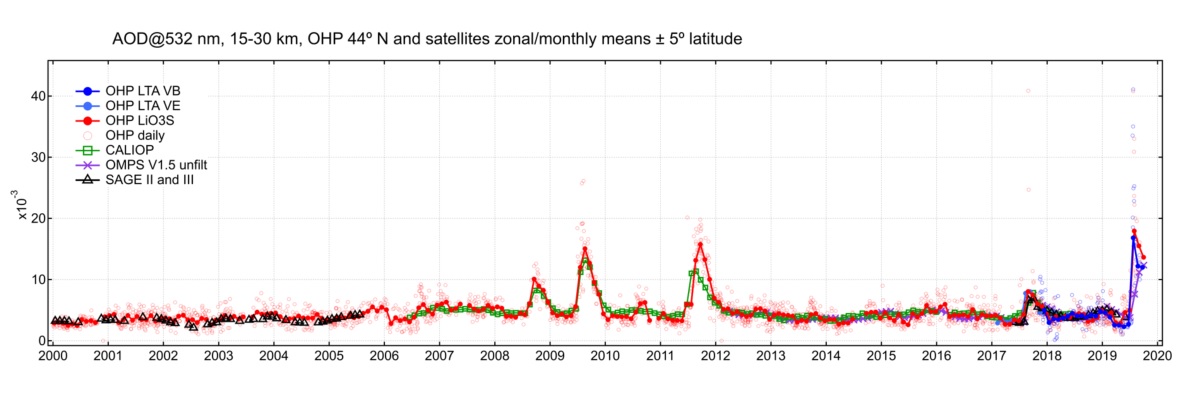
1. Raikoke within long-term NH mid-latitude stratospheric aerosol record (shared 13th Sep 2019)
20-year 532nm strat-AOD timeseries from Hautes Provence (image from Sergey Khaykin, CNRS)
The context for the Raikoke aerosol cloud, within other volcanic clouds in the post-millenium period, suggest this autumn, the Northern Hemisphere stratosphere was the most volcanically-enhanced since the global dispersion of the 1991 Pinatubo aerosol completed in the mid-1990s.
2. Minimal radiative forcing from Raikoke aerosol cloud (shared 25th and 26th Jun 2019)
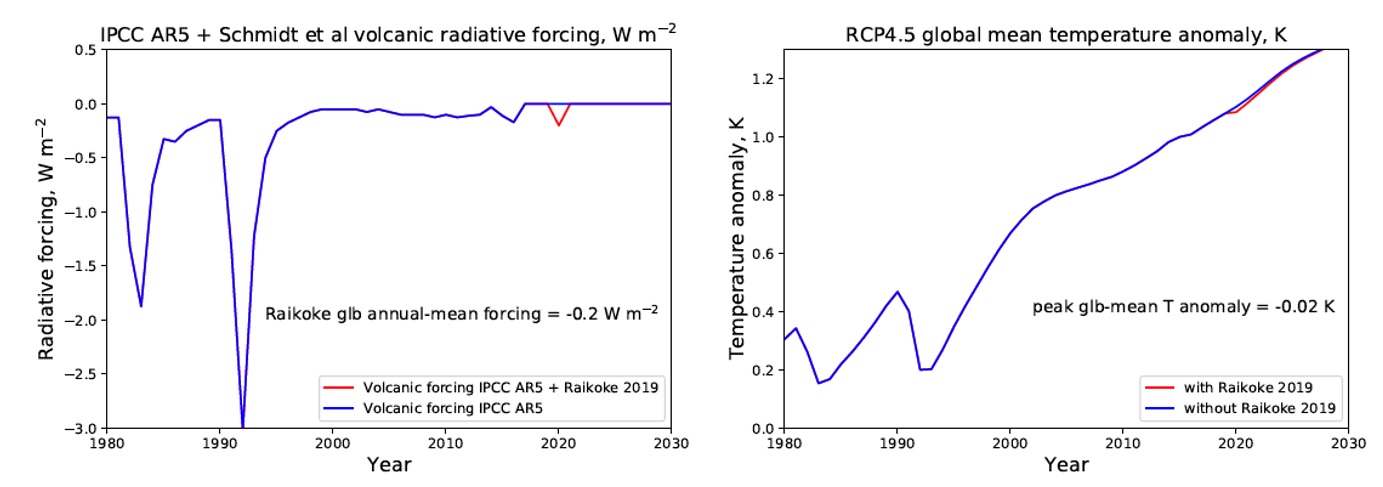
1980-2019 volcanic ERF timeseries with Raikoke (images from Anja Schmidt, Univ Cambridge)
An initial upper limit radiative forcing of 0.2 W/m2 was estimated for Raikoke, and a global temperature effect estimated applying the FAIR climate model used for climate projections in the IPCC 1.5 degree report. Despite the widespread volcanic aerosol cloud, the eruption was shown to have minimal effect on the warming trend within global mean surface temperatures.